Executive summary
The updated Metrics article on Scaled Agile Framework describes a simple and comprehensive measurement model for business agility, defined along three domains: Outcomes, Flow, and Competency. The article provides example metrics for each domain and level of the framework, but emphasizes that these examples are not exhaustive and can be supplemented by additional outcome, flow, and competency metrics provided by SAFe Enterprises.
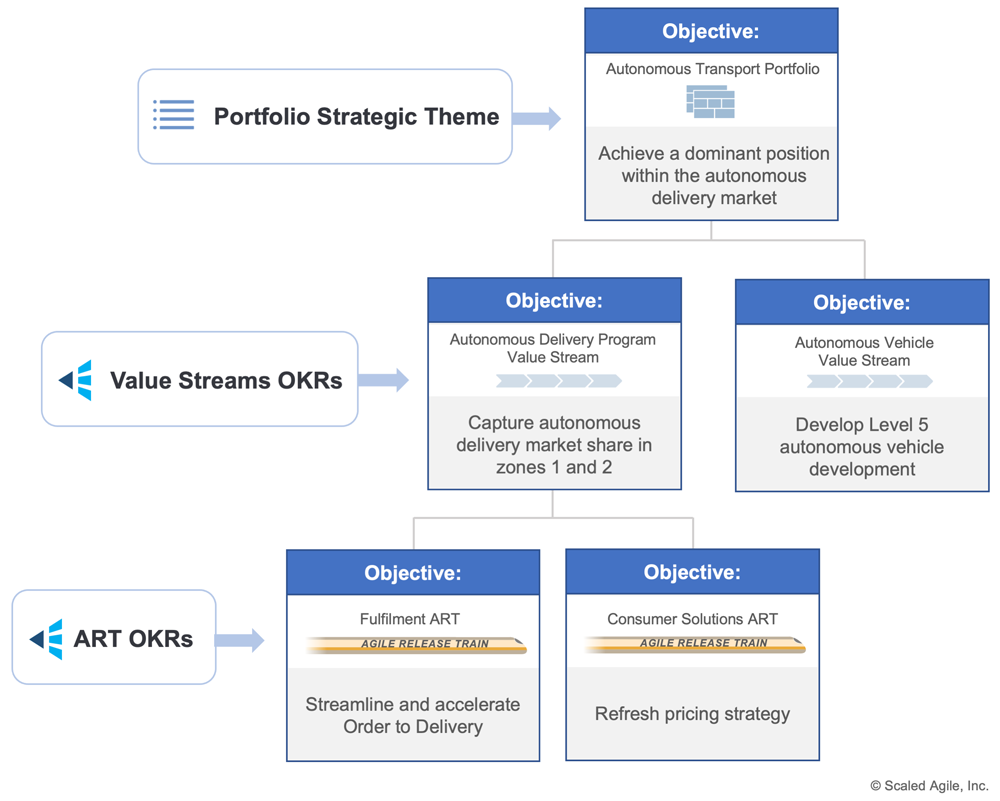
The updated article includes new additions such as Objectives and Key Results (OKRs) to enhance alignment and deliver better outcomes, employee engagement to increase productivity and innovation, flow distribution to ensure a balanced portfolio, and DORA metrics to measure DevOps capabilities. These additions provide a more comprehensive view of business agility and can help organizations track their progress toward desired outcomes.
Updated Metrics Article: Measuring Outcomes and Flow - Scaled Agile Framework
Updated Metrics Article: Measuring Outcomes and Flow
The Metrics article describes a simple yet comprehensive measurement model for business agility defined along three domains: Outcomes, Flow and Competency. Within each measurement domain, the article offers example metrics that can be applied at each level of the Framework. However, these examples were never meant to be exhaustive, and the model is designed to be extensible with other outcome, flow, and competency metrics supplemented by SAFe Enterprises, who know their business best. Some of these additional metrics are beneficial to all organizations; therefore, we have added four of these in an update to the Metrics article.
-
- Enhancing alignment and delivering better outcomes with OKRs
Outcome metrics help determine whether a development organization’s efforts produce the desired business benefit. Whereas Key Performance Indicators (KPIs) represent ongoing ‘health’ metrics that can be used to measure overall business performance and the success of existing solutions, there is a critical need to understand whether the portfolio is tracking toward outcomes needed to achieve future success and execute its strategy. Objectives and Key Results (OKRs), defined across value streams and ARTs, provide a means to maintain alignment with these outcomes and are an important addition to the article.

-
- Increasing productivity and innovation with engaged employees
Employee engagement measures the amount to which individuals feel motivated and actively engaged in supporting the organization’s goals and values. Higher levels of employee engagement result in higher productivity, efficiency, and innovation levels. Consequently, lower levels of employee engagement can lead to poor motivation, lower-quality work, and higher staff turnover. We heard from many SAFe Enterprises that this metric measures a critical internal outcome, and as such, we have added it to the measurement model.
-
- Ensuring a balanced portfolio with Portfolio Flow
Flow distribution measures the different types of work items in the system at any one time. Typically this is used for balancing customer-facing and technical work, knowing that too much of one type is detrimental. An application of flow distribution across the Portfolio has now been recognized in the article. Tracking funding distribution across investment horizons provides a means to visualize a balanced portfolio that ensures both near- and long-term health.
-
- Measuring DevOps capabilities with DORA metrics
Within and across the three measurement domains, it can often be helpful to bring together complementary metrics to provide a specific view of performance. An example is the DORA metrics used to measure the performance of an organization’s DevOps capabilities. The four DORA metrics are 1) deployment frequency, 2) lead time for changes, 3) time to restore service, and 4) change failure rate. The article now describes how each of these is an application of a flow metric designed for a particular use case.
We hope you find these additions useful as you measure your progress toward business agility.
Stay SAFe
—Andrew
